Visualizing 10 Million GeoNames with Leaflet and Solr Heatmap Facets
I wrote this post in response to some requests I had after some tweets a while ago.
A proof of concept for @ApacheSolr with @LeafletJS server side clustering using the new Solr 5.1 heatmap >100000 pts https://t.co/twydmaag7Q
— Jack Reed (@mejackreed) May 7, 2015A follow up, @ApacheSolr heatmap with >10,000,000 locations using @LeafletJS MarkerClusterer https://t.co/JrG8vudIk6 still really fast
— Jack Reed (@mejackreed) May 8, 2015A recent addition in Solr 5.1 is a new type of facet ability, Heatmap Faceting. It looks like this is another great addition added to Solr by David Smiley. I was excited to see this feature in the release notes but was curious about the practicality and performance.
Heatmap Facet basics
The Heatmap Facet will return a grid of counts for documents over a given area. The return type defaults to a 2D array of values, but can also be returned as a 4-byte PNG. These type of return values can be used to generate a heatmap visualization of result hits. Additionally, the Heatmap Facet will take several parameters that modify how the heatmap is calculated or returned. For my experimentation purposes I have only been using the facet.heatmap.geom parameter. facet.heatmap.geom will limit the region that the heatmap is computed on.
Indexing spatial data
I knew that I was going to want to put this feature through some performance trials, so I opted to start with large corpus of spatial data, the GeoNames.org seemed like a suitable dataset to start with. More on indexing GeoNames data into Solr in this other post. For the rest of this, I assume you followed this post using the default example Solr schema.
Collections and fields used here
| Collection name | GeoNames title field | Geometry field |
|---|---|---|
gettingstarted |
title_t |
loc_srpt |
Heatmap requests and returns
For this blogpost, I only dealt with the Solr Heatmap Facet return using the 2D array of hit counts. The basic idea of the feature is that I can request a bounding area, and get return hit counts for items within that area.
An example request
A basic Facet Heatmap request:
http://localhost:8983/solr/gettingstarted/select?q=*:*&facet=true&facet.heatmap=loc_srpt&facet.heatmap.geom=["-180 -90" TO "180 90"]&wt=json
Let’s break down this request:
| Request parameter | What does it do? |
|---|---|
q=*:* |
Select all documents |
facet=true |
enable faceting |
facet.heatmap=loc_srpt |
field name for heatmap faceting (needs to be type RPT) |
facet.heatmap.geom=["-180 -90" TO "180 90"] |
the region where the heatmap is computed |
wt=json |
return it in JSON |
An example return
The example request above will return hit counts for the entire world. This will be in the form of a 2D array. The return from Solr will look something like this:
// Normal Solr response
...
"facet_counts":{
    ... // facet response fields
    ...
    "facet_heatmaps":{
      "loc_srpt":[
        "gridLevel",2,
        "columns",32,
        "rows",32,
        "minX",-180.0,
        "maxX",180.0,
        "minY",-90.0,
        "maxY",90.0,
        "counts_ints2D", [null, null, [0, 0, ... ]]
...
The response here gives us a lot of useful information we can use to build a mapping interface to visualize the hits. The return isn’t necessarily a JSON object but is an array, lets just call it an object with keys (even array index values) and values (odd array index values).
| Response key | What does it tell us? |
|---|---|
gridLevel |
granularity of each grid cell |
columns |
number of columns in 2D array return |
rows |
number of rows in 2D array return |
minX, maxX, minY, maxY |
region heatmap 2D array was computed for |
counts_ints2D |
2D array of integers that are counts for a given region |
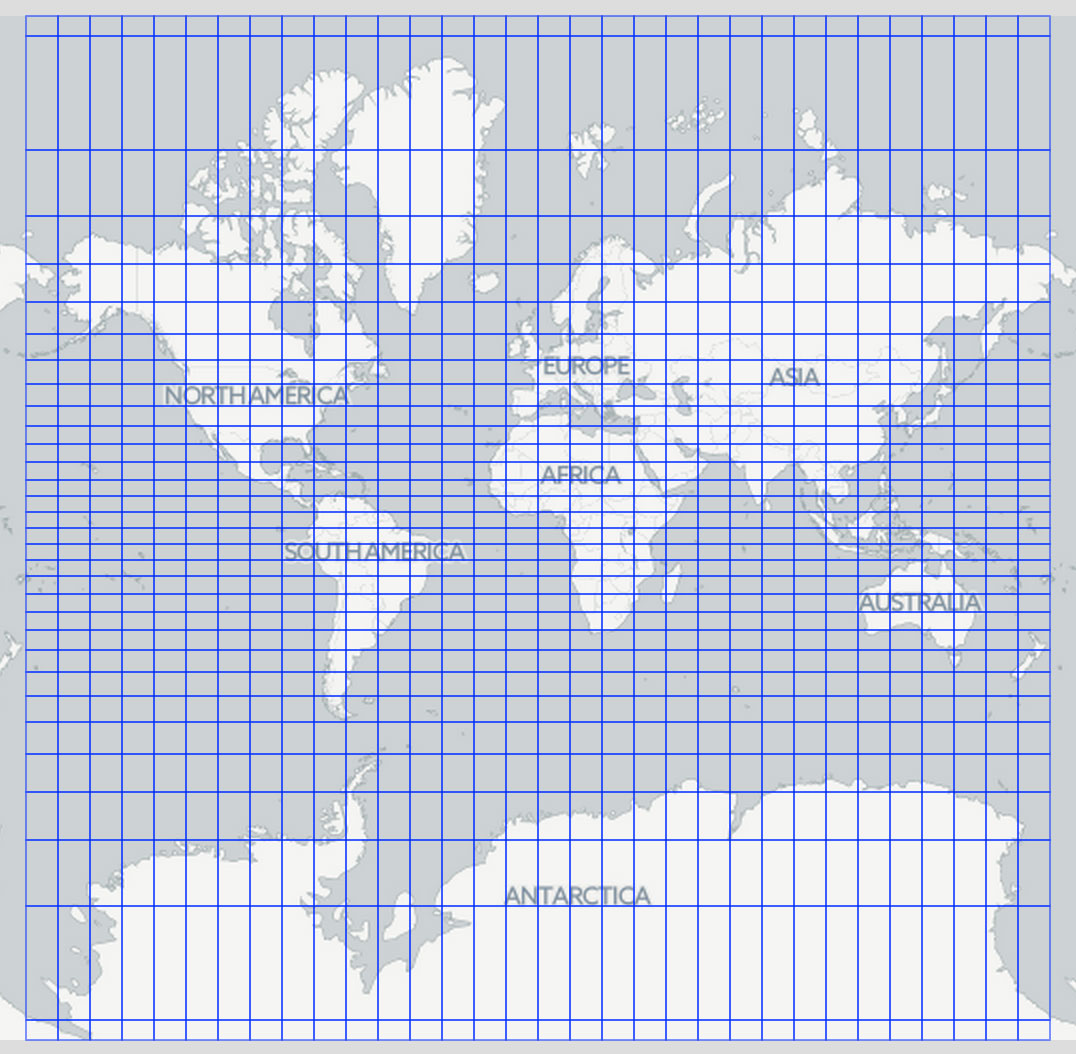
Transforming it into a grid
counts_ints2D can be transformed into a grid. Below is an equal degree grid computed from a 32 x 32 2D integer array for the entire world ([“-180 -90” TO “180 90”]).
Visualizing with Leaflet.js
The next step is to turn the 2D integer array into a visualization depicting hit counts on a map. Leaflet.js is my goto mapping library so I created a quick Leaflet plugin, Leaflet-Solr-Heatmap, that creates a GeoJSON grid from the resulting response from Solr.
Using this plugin, with the 10 million plus GeoNames corpus will yield a result like this:
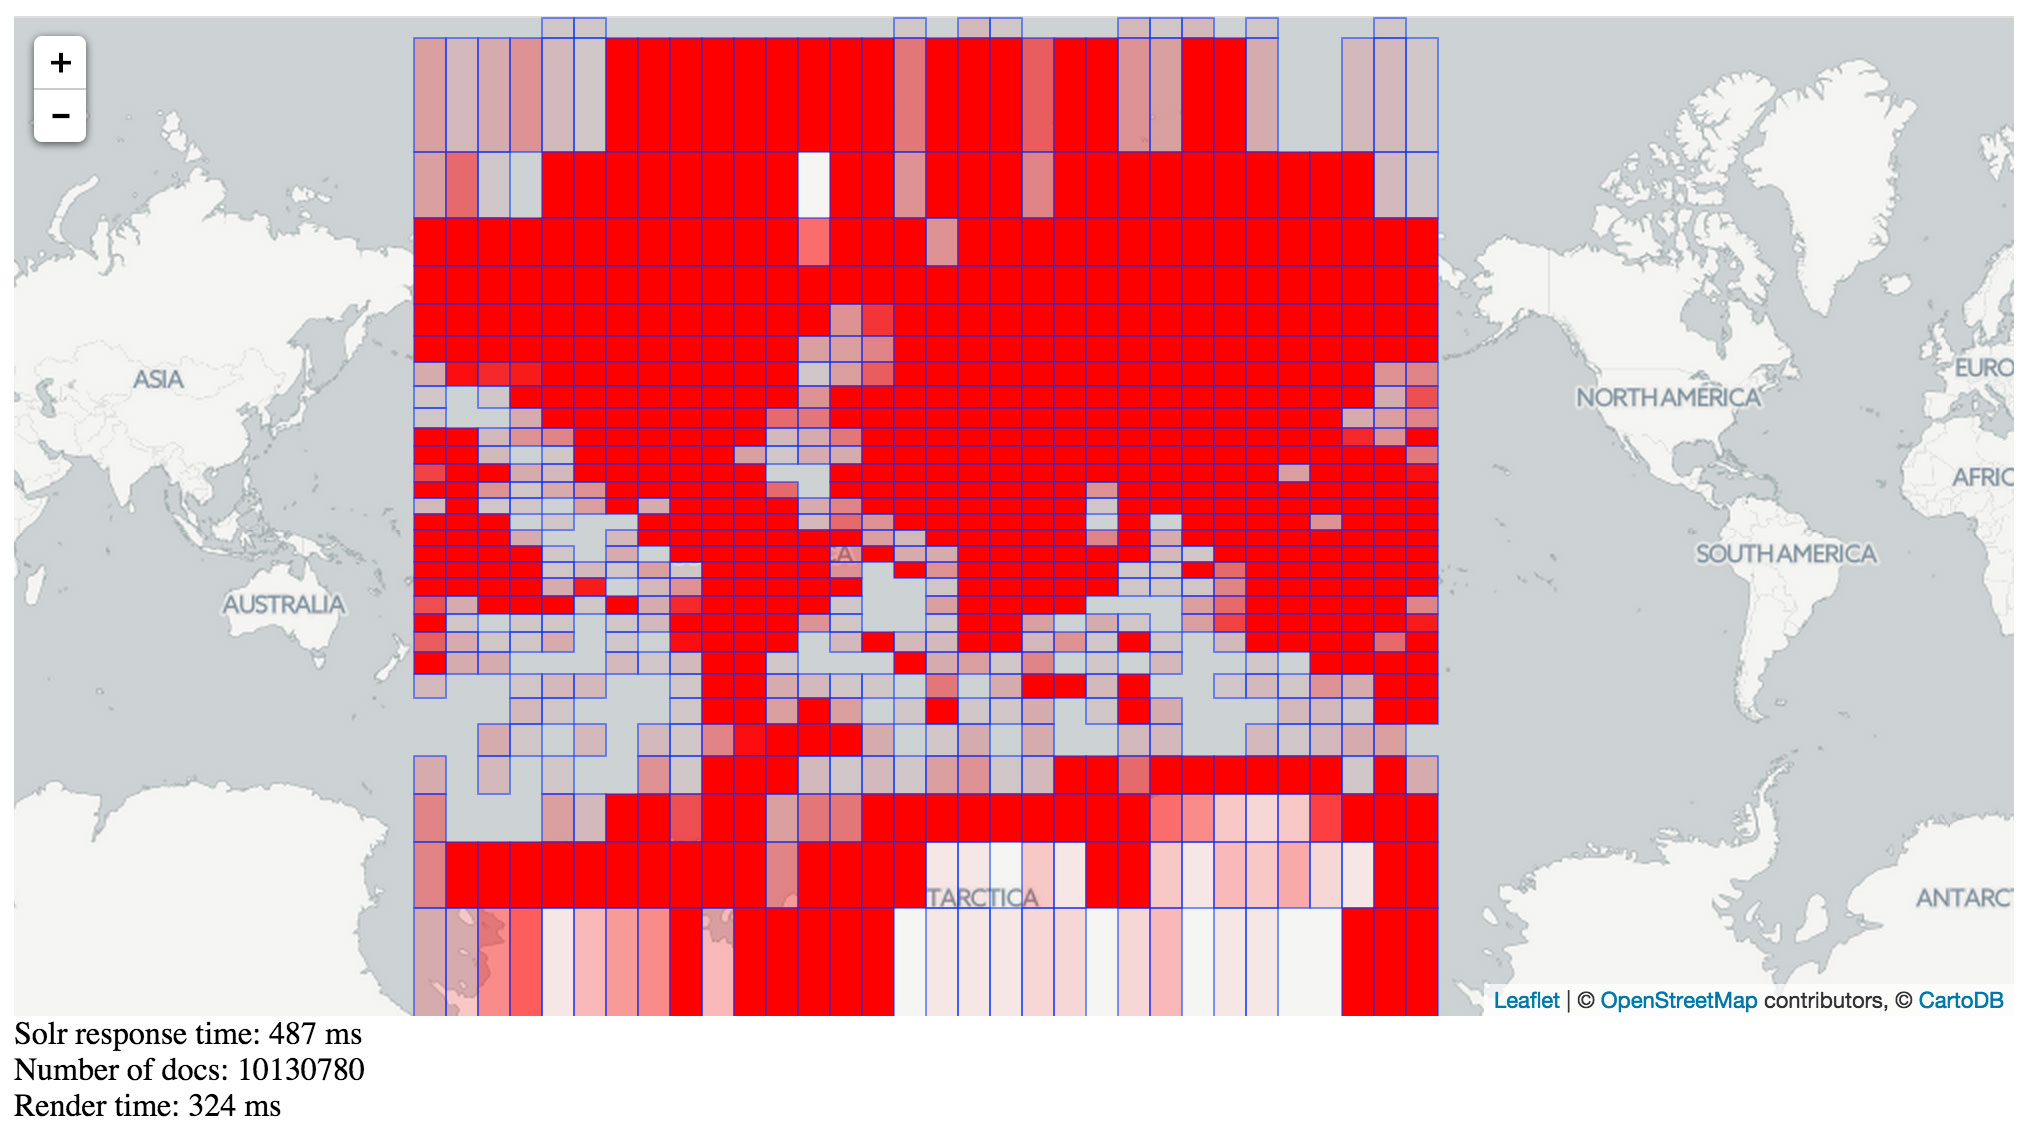 The plugin does a really naive classification of density using color. Future work can implement something a bit more scientific.
 You may notice, I’ve included in the example Solr response and Leaflet rendering times. Here is a version using the MarkerClusterer functionality in the Leaflet-Solr-Heatmap plugin.

As you zoom further in, the plugin will send a facet query that limits the response area to the map view. This significantly increases performance of the Solr faceting at lower zoom levels. Solr will also dynamically modify the grid resolution as you zoom further in.
Going from here
This is really just a proof of concept of performance for a large geospatial dataset. Its really exciting to this fast performance with such a large dataset. I might next try and do something similar with a polygon geometry dataset to see how that works, maybe quattroshapes? I’m also interested in future work on a Blacklight plugin that will use this functionality to visualize search results. If your interested in working something collaboratively connect with me on Twitter.